Human beings are known for a myriad of different things, and yet most importantly, we are known for getting better on a consistent basis. This tendency to improve, no matter the situation, has empowered the …
Human beings are known for a myriad of different things, and yet most importantly, we are known for getting better on a consistent basis. This tendency to improve, no matter the situation, has empowered the world to realize some huge milestones, with technology emerging as quite a major member of the group. The reason why we hold technology in such a high regard is, by and large, predicated upon its skill-set, which guided us towards a reality that nobody could have ever imagined otherwise. Nevertheless, if we look beyond the surface for a second, it will become clear how the whole runner was also very much inspired from the way we applied those skills across a real world environment. The latter component, in fact, did a lot to give the creation a spectrum-wide presence, and as a result, initiate a full-blown tech revolution. Of course, this revolution eventually went on to scale up the human experience through some outright unique avenues, but even after achieving a feat so notable, technology will somehow continue to bring forth the right goods. The same has turned more and more evident in recent times, and assuming one new discovery ends up with the desired impact, it will only put that trend on a higher pedestal moving forward.
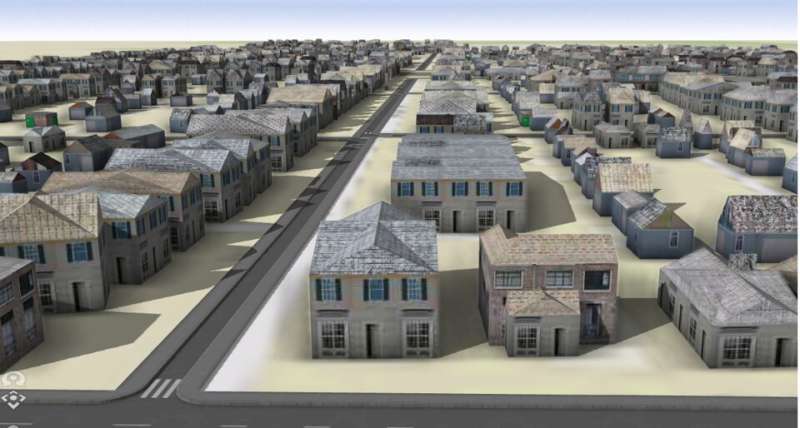
The researching team at Ohio State University has successfully developed a method where we can use machine learning and historic Sanborn Fire Insurance maps to create 3D digital models of historic neighborhoods. According to certain reports, the primary purpose connected to these models could be estimating the economic loss caused by the demolition of historic neighborhoods. Talk about what steps came together and culminated in such a move, the explanation begins from Sanborn maps, a tool specifically created to help fire insurance companies assess their liability in about 12,000 cities and towns across the United States during the 19th and 20th centuries. However, the challenge with this method was how manually collecting usable data from these maps was tedious and time-consuming. To take on against the problem, the researchers developed machine learning tools that can seamlessly extract details about individual buildings from the maps, including their locations and footprints, the number of floors, their construction materials and their primary use like dwelling or business.
“The story here is we now have the ability to unlock the wealth of data that is embedded in these Sanborn fire atlases,” said Harvey Miller, co-author of the study and professor of geography at The Ohio State University. “It enables a whole new approach to urban historical research that we could never have imagined before machine learning. It is a game changer.”
The team further tested its approach on two adjacent neighborhoods located at the near east side of Columbus, Ohio that were destroyed in the 1960s to make way for the construction of I-70 highway. Here, they used 13 Sanborn maps for the two neighborhoods produced in 1961, just before I-70 was built. Going by the available details, the ML-driven system was able to pull data from the maps and create digital models, models which showed a total of 380 buildings were demolished in the two neighborhoods for the highway, including 286 houses, 86 garages, five apartments and three stores. As for the accuracy of the said figures, the researchers discovered that the model was 90% accurate when it came down to building footprints and construction materials.
“The accuracy was impressive. We can actually get a visual sense of what these neighborhoods looked like that wouldn’t be possible in any other way,” said Miller. “We want to get to the point in this project where we can give people virtual reality headsets and let them walk down the street as it was in 1960 or 1940 or perhaps even 1881.”
Moving on to possible use cases, the hope is, considering Sanborn maps include information on businesses that occupied specific buildings, is to study the economic impact of losing them. Another application could be gauging how replacing homes with highways that absorbed the sun’s heat affected the urban heat island effect.
“Making these 3D digital models and being able to reconstruct buildings adds so much more than what you could show in a chart, graph, table or traditional map. There’s just incredible potential here,” said Miller.


