


Accurate information delivered at the right moment can make all the difference. Leaders entrusted with managing operations, public safety, and economic development for communities – whether on military installations or in cities – constantly strive …

0
Accurate information delivered at the right moment can make all the difference. Leaders entrusted with managing operations, public safety, and economic development for communities – whether on military installations or in cities – constantly strive toward making data-driven decisions.
However, with a constant influx of unorganized and sometimes conflicting information, decision-makers must allocate resources to structure and analyze the data before acting. As a nonprofit innovation partner to city and installation leaders across the United States, US Ignite set out to pilot geospatial dashboards to help generate a better system.
The resulting dashboards effectively provided leaders with proactive recommendations, resulting in reduced operational costs, conserved energy, improved road safety, and increased overall efficiency.
The Power of Geospatial Dashboards for Public Sector Innovation
Like a vehicle’s dashboard, a geospatial dashboard provides key real-time information to help inform the user’s next moves. Instead of displaying information from one system, however, geospatial dashboards aggregate real-time data from multiple disparate systems.
The essential building blocks required to create a geospatial dashboard include access to secure and open data, a cloud infrastructure, network availability, and IoT sensor infrastructure, and geospatial data. On the back end, these layers of information are transformed into visualizations that users can utilize to gain data insights and make data-driven decisions.
Accessing data and visualizations in a single interactive dashboard can be particularly valuable to leaders managing complex operations, as it enables faster identification of the best next step. When combined with advanced data analytics and Artificial Intelligence (AI), geospatial dashboards can even make proactive recommendations.
Artificial Intelligence for Traffic and Weather Application
At Fort Carson, US Ignite collaborated with base leadership to design, develop, and implement the Inclement Weather Decision Support (IWDS) Application. The IWDS not only had a user-friendly interface summarizing the weather and traffic safety risk levels, but it also generated AI-powered recommendations for Fort Carson leaders when facing potentially hazardous weather conditions.
During adverse weather conditions, Fort Carson leaders must balance the urgency of ongoing operations (e.g., whether to close or remain open) with commuter safety. The IWDS utilized weather forecasts and micro weather station data to provide a real-time map of Fort Carson’s roadways. The map color-codes roads based on the predicted safety and criticality of the passageway. At a glance, users could discern the severity of the situation. Moreover, an AI model trained with historical forecast data and roadway characteristics, advised users on the likelihood of crashes.
The IWDS app enabled Fort Carson leaders to delve into the data, drilling down into weather, roadway, and regional layers to gain a detailed understanding of the situation.
Command and Control with the Installation Operations Tool
Taking the possibilities of AI-powered geospatial dashboards further, at Fort Benning, GA, US Ignite has been developing a system-of-systems dashboard that provides Fort Benning leaders with a Common Operating Picture (COP) to
 support installation management, known as the Installation Operations Tool (IOT). The IOT is an acting prototype for the U.S. Army’s Virtual Toolbox for Installation Mission Effectiveness (VTIME) Program. Several solutions power the IOT. The following two specifically demonstrate the immense power of geospatial data for Fort Benning leaders:
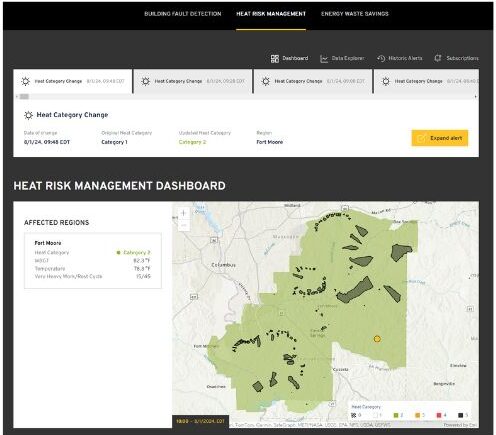
- Heat Risk Management (HRM) aims to reduce heat-related injuries and illnesses by generating a Fort Benning map that shows the real-time, hyper-local heat intensity. HRM gives recommendations for training intensity based on IoT sensor data and weather data.
- Energy Waste Savings (EWS) monitors weekly occupancy data from cell phone pings, along with energy consumption and pricing data to optimize HVAC and electrical system management. The dashboard provides visualizations of energy trends and delivers real-time savings through dynamic energy use management.
These and other IOT solutions create improvements that result in more efficient resource coordination and allocation, enhanced mission readiness, and improved emergency response capabilities.
State and City Use Cases
Geospatial dashboards can also deliver benefits to municipal and state governments. US Ignite has collaborated with several U.S. communities to create customized geospatial dashboards. Created with the unique problem the community wants to tackle as a guiding north star, and with the local stakeholders as design partners, these tools showcase how pairing geospatial data with other available data can help leaders deliver improved public services and resources for residents.
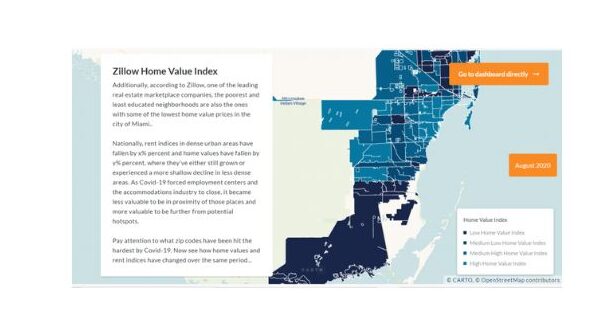
Screenshot of Miami Economic Development Dashboard
For example, the Miami Economic Development Dashboard combines four indexes – economic vulnerability, unemployment rate, employment, and industry health – to render a visualization of Miami’s economic development by zip code. With this tool, city leaders are better equipped to take data-driven steps without needing to be an expert statistician.
Similarly, US Ignite built the National Socioeconomic Impact Broadband Tool to help state leaders understand the current disparities in broadband accessibility and how investments in broadband expansion could drive social and economic improvements. Using supervised machine learning and clustering, the geospatial data is converged with socioeconomic factors, broadband availability, and performance data. The layered map helps decision-makers understand where an influx of funding could have the most positive impact for residents.
The power of ongoing real-time analysis provided by geospatial dashboards can empower community leaders to address specific challenges more quickly and accurately.
Looking Ahead
The use cases mentioned in this article demonstrate that a geospatial dashboard supports leaders in achieving improved real-time security and safety, optimized energy use, and infrastructure planning.
Imagine supercharging the functionalities of the next generation of geospatial dashboards with emerging technologies like digital twins, augmented reality (AR), virtual reality (VR), and, of course, generative AI.
What if a geospatial dashboard could not only visualize data but also create submission-ready funding proposals backed by real-time data?
What if we could integrate public engagement tools into infrastructure and resource allocation planning?
Without doubt, geospatial dashboards will continue to evolve and become even better tools for public leaders navigating a world increasingly shaped by data-driven approaches. Throughout these changes, US Ignite will remain a trusted partner helping communities strive for a better future.